 Buy Crypto
- Markets
 Futures
- Spot
- Copy Trade
- Earn
- More
Stop Talking About Gold, Bitcoin Is Not a Safe Haven Asset
Original Article Title: When Bitcoin Bottoms
Original Article Link: @abetrade
Translation: Peggy, BlockBeats
Editor's Note: As Bitcoin struggles while gold and US stocks continue to hit new highs, the narrative of "funds rotating from precious metals to crypto assets" has once again become popular in the market. This article does not follow this intuitive judgment to provide trading conclusions, but instead returns to the data itself, systematically verifying whether there is a truly verifiable long-term relationship between Bitcoin and gold.
Through correlation and cointegration analyses, it can be seen that there is no robust mean reversion or structural relationship of "one's loss is another's gain" between Bitcoin and gold. The so-called rotation is more of a hindsight explanation rather than a repeatable, verifiable market mechanism. Bitcoin is neither a safe-haven metal nor a stock index; it is a highly volatile, evolving independent market.
The article further points out that determining Bitcoin's bottom, rather than applying analogies to other assets, is better achieved by focusing on factors that truly determine market trends, such as positioning, derivative structures, and emotional capitulation. Historical experience shows that most true bottoms are formed when almost everyone has already given up.
Below is the original article:
The crypto market is not currently hot. Just as stock and metal prices are hitting new all-time highs, crypto assets have been on a "pain train" since last October.
Recently, the timeline has been filled with a saying: "Funds are rotating from precious metals to crypto assets, ready to happen at any time." Unfortunately, those who express this view are often notorious in the industry for being "all talk," with their only consistent PnL coming from the monthly interaction fees earned on X platform.
I want to take some time to analyze whether this so-called "rotation from precious metals to crypto" has any substantive basis (spoiler alert: it doesn't), and then share some key turning points in the history of the crypto market and how you can identify these moments.
Relationship Between Bitcoin and Gold
Firstly, an obvious question arises: if you want to find a relationship between the peak of gold and the performance of Bitcoin, the premise is that gold itself must frequently "peak." However, in fact, true peaks of gold have been scarce over the past decade.
"Shooting up" is certainly exciting, but when expressing views on the Internet, it's best to have data to support them, lest you sound like a complete fool. In the past decade, gold has only experienced three reasonably significant pullbacks: in 2018, 2020, and 2022. That is to say, only three data points. Just this fact alone is enough to make me stop further research; however, to complete this article, let's delve deeper for the sake of it.
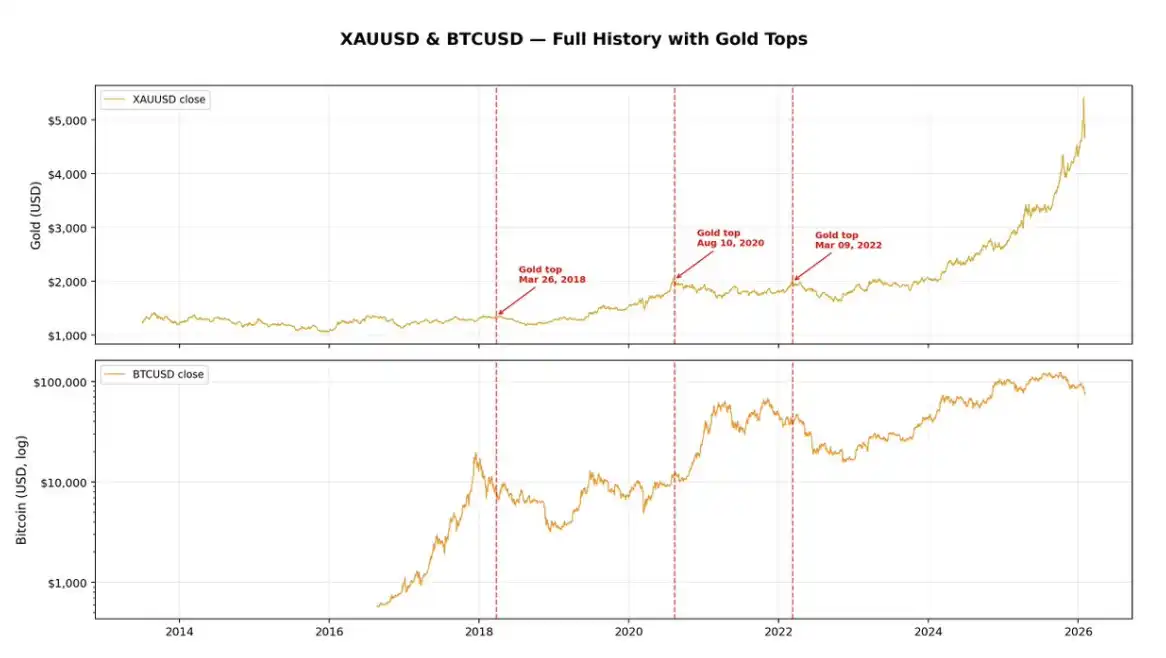
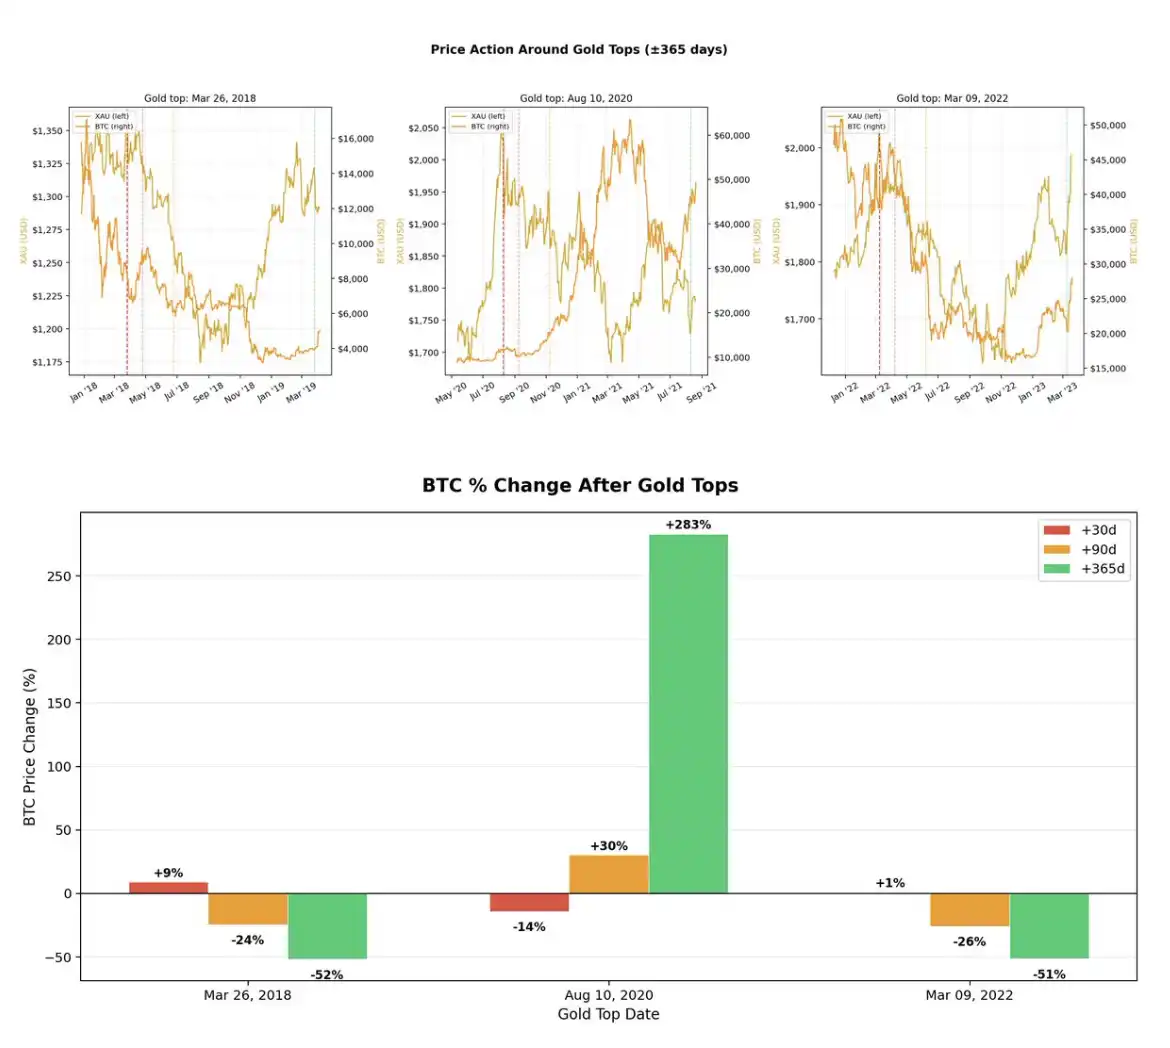
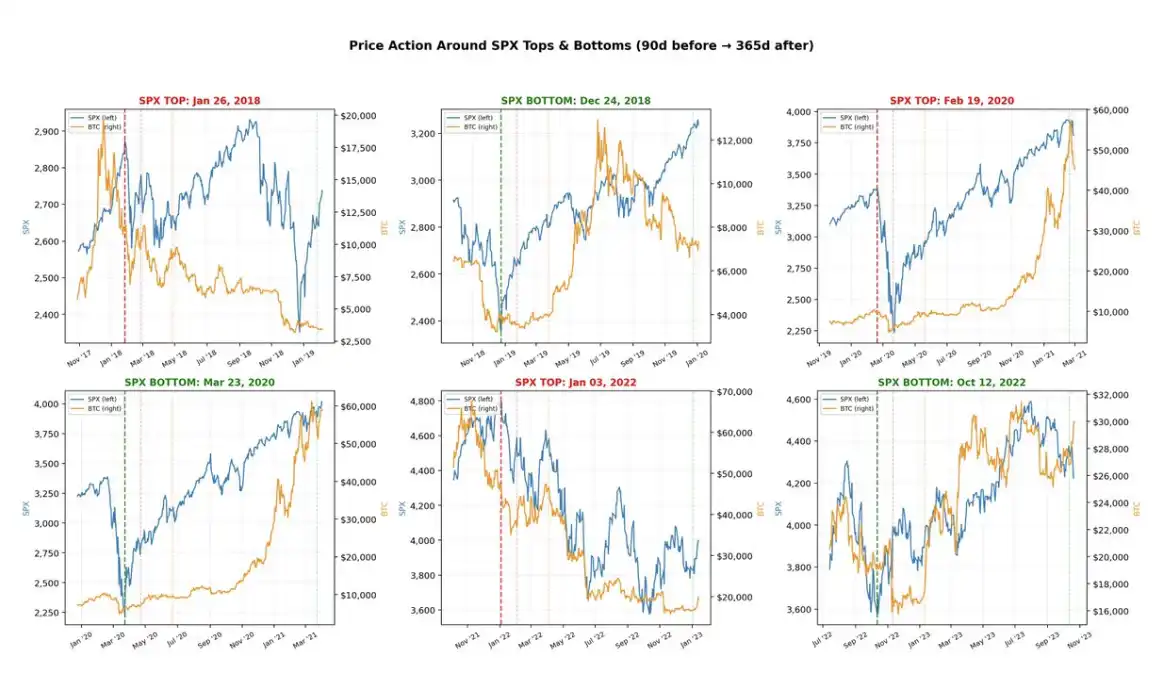
If you look at the chart above, you will see that out of the three cyclical gold highs, two actually occurred before a Bitcoin downtrend, in 2018 and 2022, respectively. The only time Bitcoin saw strength after a gold pullback was during the typical "risk-on" frenzy in 2020.
Over the past decade or so, Bitcoin and gold have had an overall correlation coefficient close to 0.8, which is not surprising—both markets have been on the rise in the long term. But correlation doesn't answer the real question you care about.
If you want to assess whether there is a "give-and-take, strength rotation, eventual return" relationship between the two assets, merely looking at correlation is not enough; you need to look at cointegration.
Cointegration
Correlation measures whether two assets "move together" in daily fluctuations.
Cointegration, on the other hand, asks a different question: Do these two assets maintain a stable relationship in the long run, such that they are pulled back together when deviating?
You can think of it as two drunk people walking home together:
They may stagger, take a confused route individually (non-stationary), but if they are tied together with a rope, they can't wander too far from each other. That "rope" is the cointegration relationship.
If the narrative of "funds rotating from gold to crypto assets" indeed has substance, then you would need to see cointegration between Bitcoin and gold—meaning, when gold surges while Bitcoin significantly underperforms, there should be some real force in the market bringing them back to the same long-term trajectory.
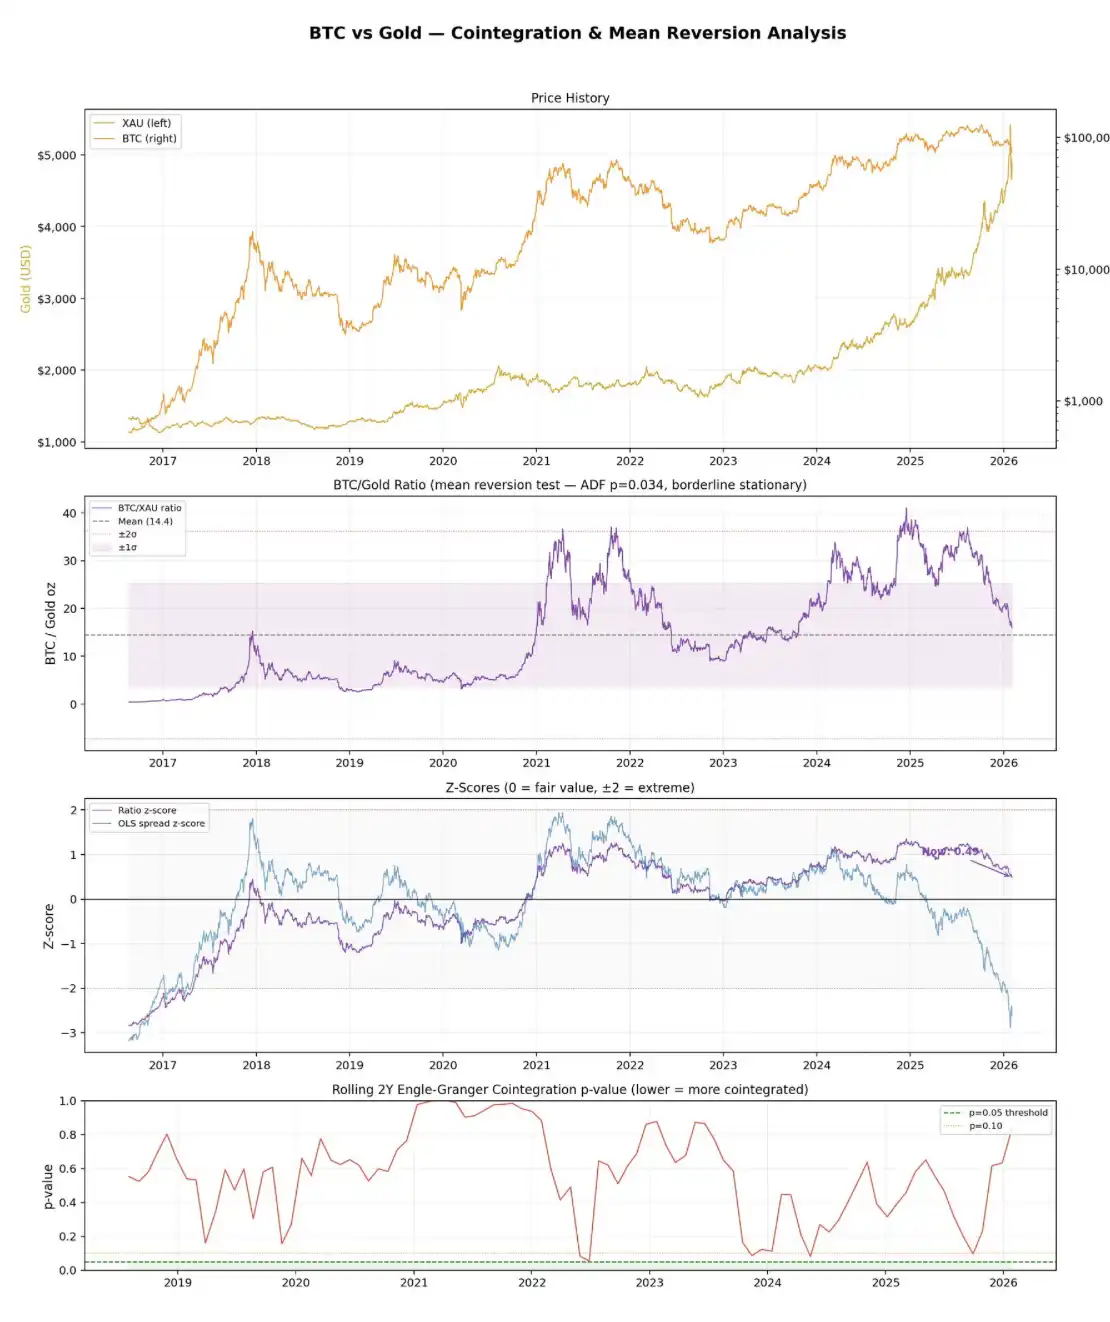
Combining the information from the chart above, what the data truly conveys is this: The Engle-Granger Cointegration Test did not find any cointegration relationship.
The full-sample p-value is 0.44, well above the usual 0.05 significance threshold. Looking further into rolling two-year windows, out of 31 intervals, not a single one shows a cointegration relationship at a 5% significance level. Additionally, the price spread residuals themselves are non-stationary.
A simpler BTC/Gold ratio looks slightly more "optimistic," but not by much. Conducting an ADF test on this ratio resulted in just about stationarity (p = 0.034), indicating a very weak mean-reverting characteristic may exist. However, the issue lies in its half-life of about 216 days, nearly 7 months—an absurdly slow pace, almost entirely drowned in noise.
From the current level, Bitcoin's price is roughly equivalent to 16 ounces of gold, about 11% higher than the historical average of 14.4. The corresponding z-score is -2.62, suggesting that from a historical perspective, Bitcoin appears relatively "undervalued" compared to gold.
But here's the key: this reading is mainly driven by gold's recent parabolic rise, not because there is some reliable mean-reverting relationship between the two to pull them back together.
In fact, there is no robust cointegration. They are fundamentally two entirely different asset classes: gold is a mature safe-haven asset, while Bitcoin is a highly volatile risk asset that just happened to exhibit an upward trend during the same period.
If all the above sounds like gibberish to you, here's an ultra-brief crash course in statistics:
The Engle–Granger test is the standard method for assessing cointegration. It regresses two assets and then tests whether the regression residual (i.e., the "price difference" between the two) is stationary—whether it fluctuates around a stable mean, not drifts infinitely. If the residual is stationary, it indicates cointegration between the two assets.
The ADF test (Augmented Dickey-Fuller) is used to test for stationarity in a time series. It essentially tests for the presence of a "unit root," colloquially meaning whether the sequence trends indefinitely or reverts to a mean.
A p-value below 0.05 means you can reject the unit root hypothesis, affirming the series' stationarity and existence of mean reversion.
Half-life describes how quickly mean reversion occurs. If a price difference has a half-life of 30 days, it means that after being pulled apart, it would take about a month to correct halfway back.
Short half-life = tradable;
Long half-life = basically useless except for "HODL and pray."
Ultimately, I've always felt that attempting to forcibly relate Bitcoin to any traditional financial asset is inherently absurd. Most of the time, people just use such comparisons to cater to the narrative that best suits their current position: today Bitcoin is "digital gold," tomorrow it transforms into "leveraged Nasdaq."
In contrast, its correlation with the stock market is actually much more real. Over the past five years, Bitcoin's tops and bottoms have been highly synchronized with the S&P 500 (SPX) — until this stage: the SPX is still comfortably near its all-time high, while Bitcoin has retraced 40% from its peak.
For this reason, you should consider Bitcoin as a standalone entity. It's not a metal — no one would consider an asset with an annualized volatility of over 50% as a safe-haven asset (for comparison, gold has an annualized volatility of about 15%, and even then, it is considered high in the "value storage" asset class).
It's also not a stock index — Bitcoin has no component stocks, essentially it's just a piece of code.
Over the years, Bitcoin has been wrapped in various narratives: a payment tool, a store of value, digital gold, a global reserve asset, and so on.
These statements all sound great, but the reality is, it's still a relatively young market, and it's hard to argue that, apart from being a "speculative asset," it already has a clear, stable real-world use case. Ultimately, treating it as a speculative asset is not a problem in itself; the key is to maintain a clear and realistic understanding of this.
Bottom
Trying to catch Bitcoin's bottom stably and reliably is extremely difficult — of course, no market is easy, but the issue with Bitcoin is that it has changed so rapidly over these years that even historical patterns have become increasingly less relevant.
Ten years ago, the market structure of gold and the S&P 500 (SPX) did not change much compared to now;
but in 2015, one of the main use cases for holding Bitcoin was still to buy heroin online.
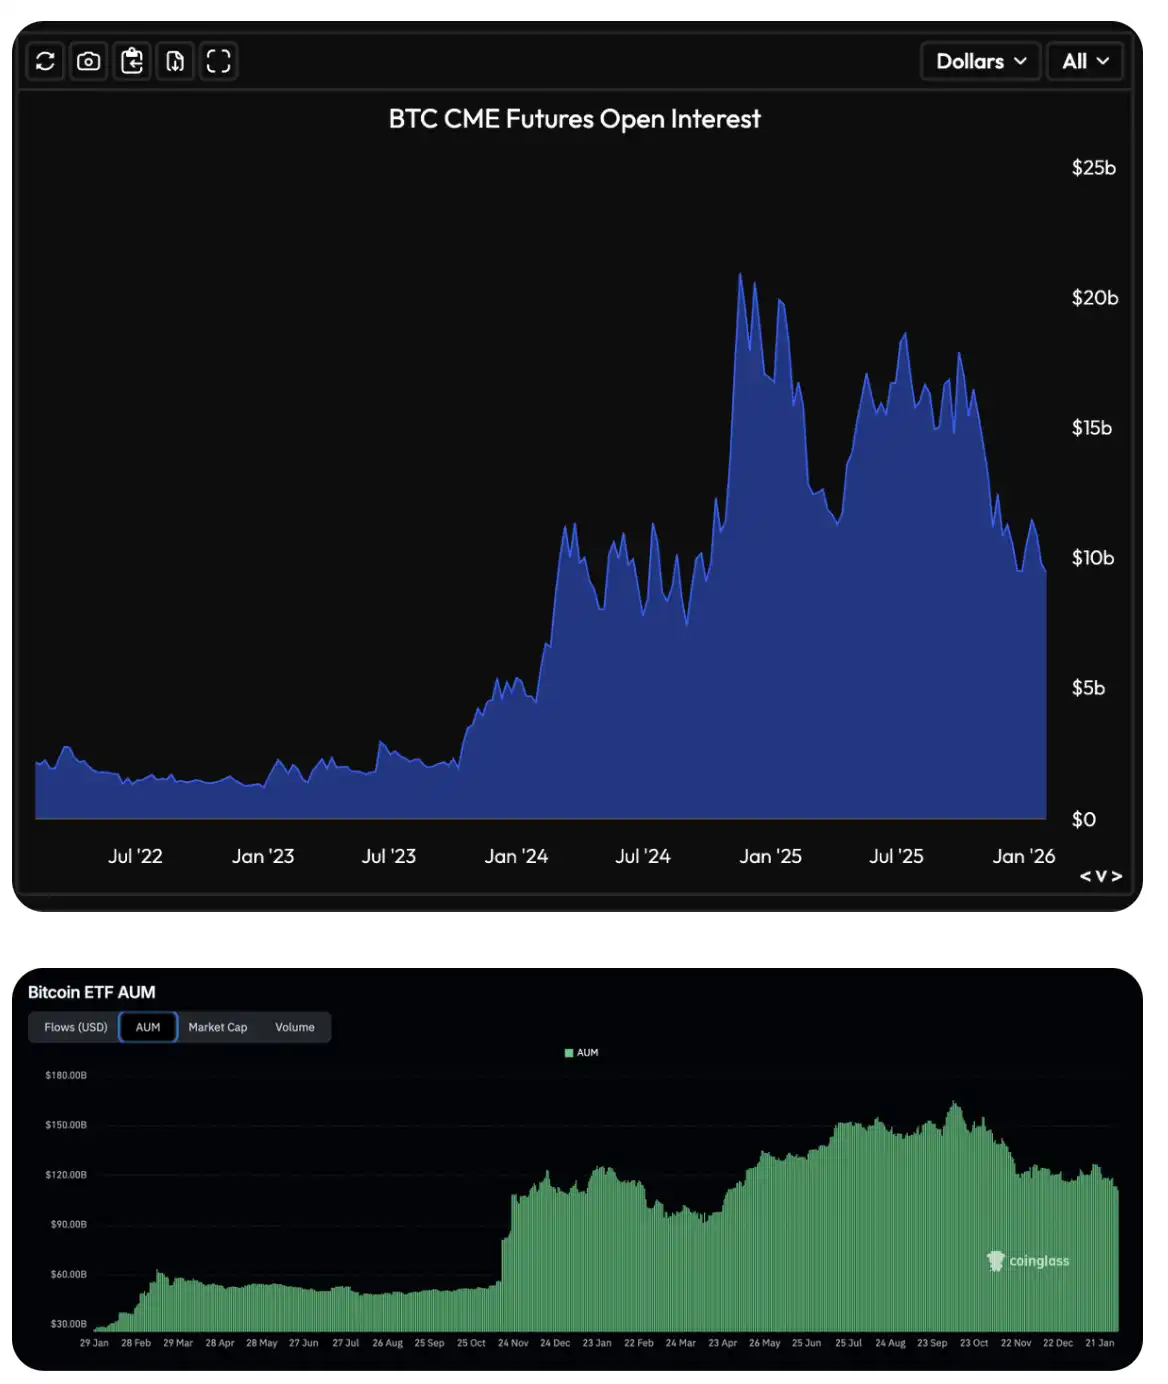
This has clearly undergone a monumental change. Today, market participants are much more "respectable," especially after the significant increase in open interest in CME Bitcoin futures and options in 2023, and the launch of Bitcoin ETFs in 2024, institutional funds have officially and massively entered this market.
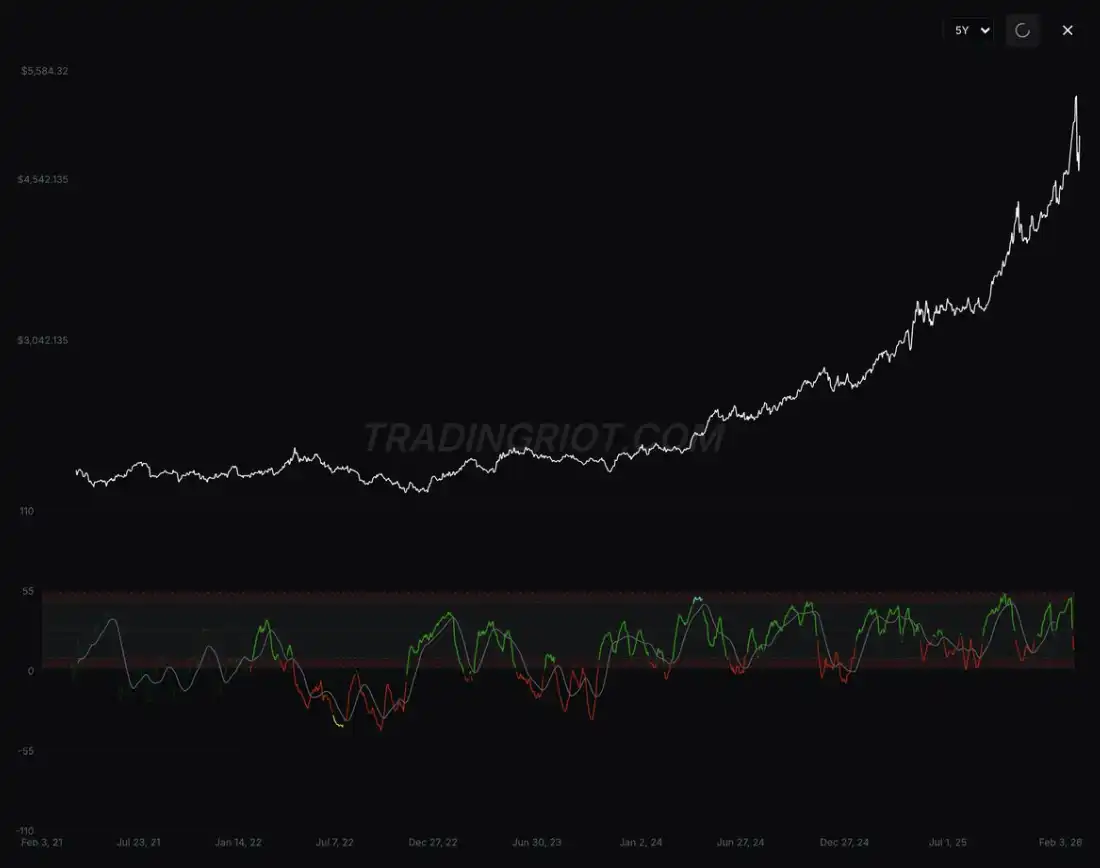
Bitcoin is an extremely volatile market. If there is any conclusion that we can relatively confidently state, it is that: market bottoms are often accompanied by intense overreactions on various derivatives and "stampede-style liquidation."
This signal is reflected both in native crypto metrics, such as open interest and funding rates experiencing extreme fluctuations, and in more institution-focused metrics, such as options skew and abnormal changes in ETF flows.
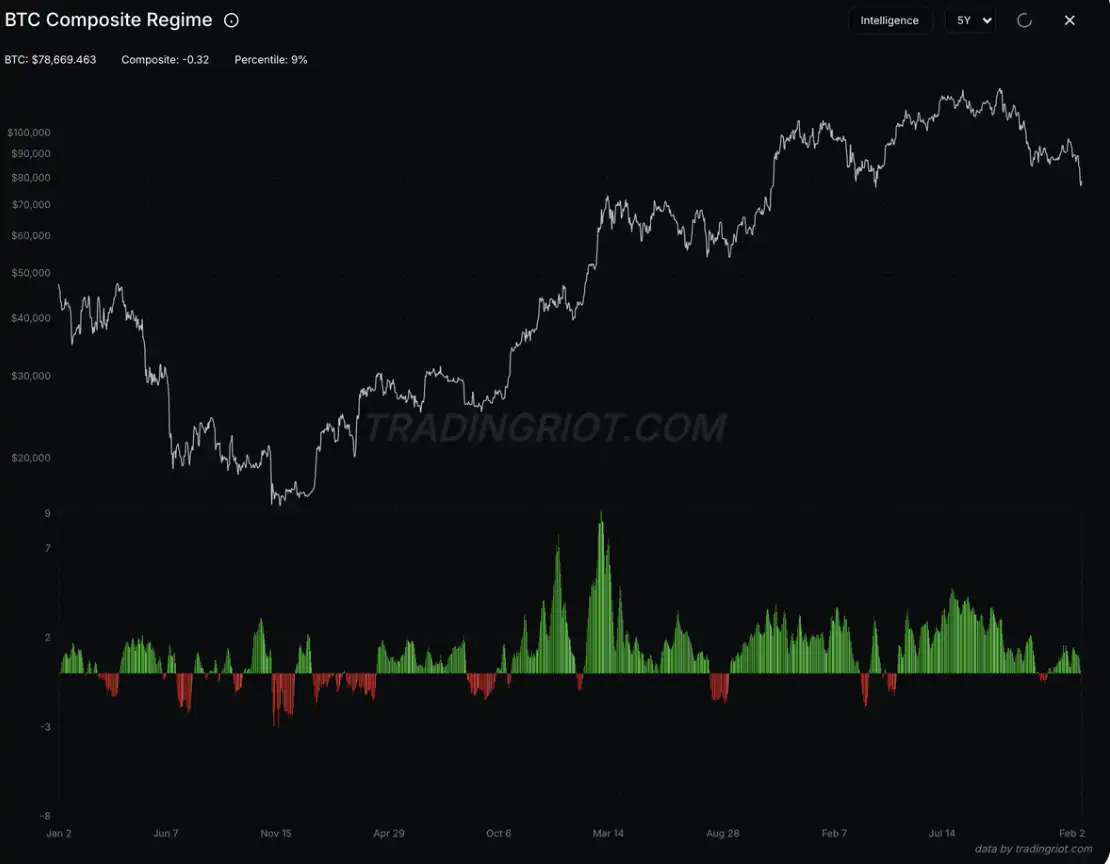
I personally have built an indicator that integrates these signals into a composite regime for tracking (please note that this indicator is currently not publicly available, sorry). As seen in the chart, the areas highlighted in red typically correspond to phases of extreme market sentiment: decreasing open interest, negative funding rates, traders overpaying for bearish option premiums, and realized volatility surpassing implied volatility.
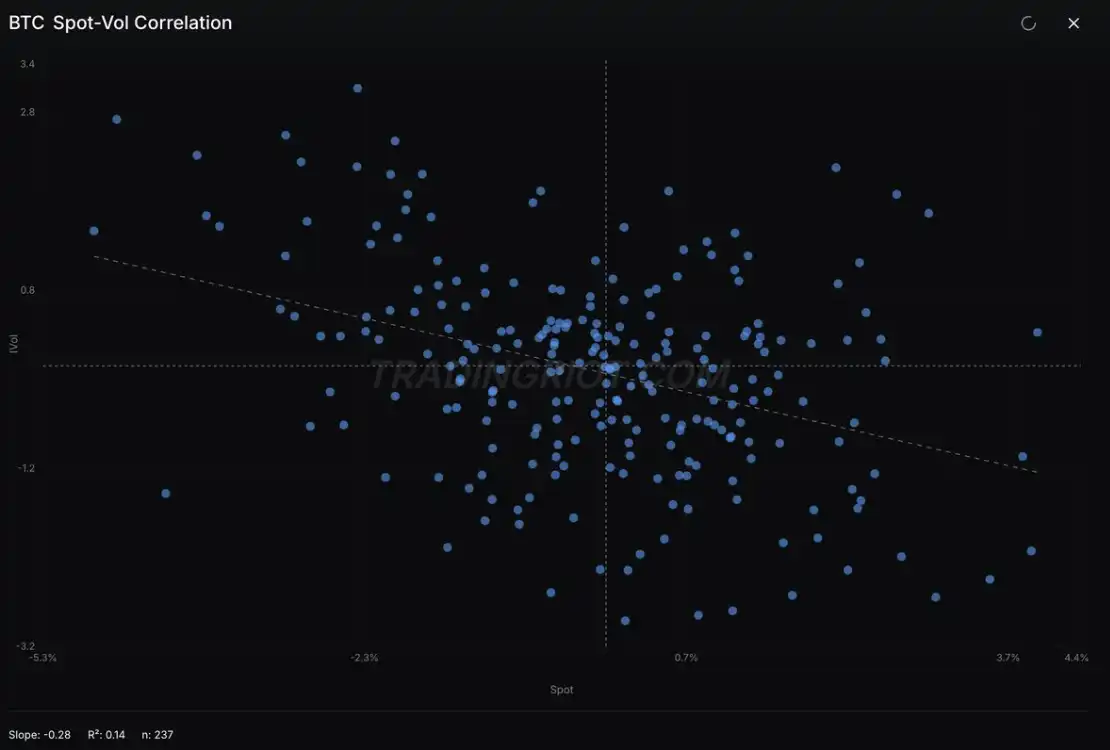
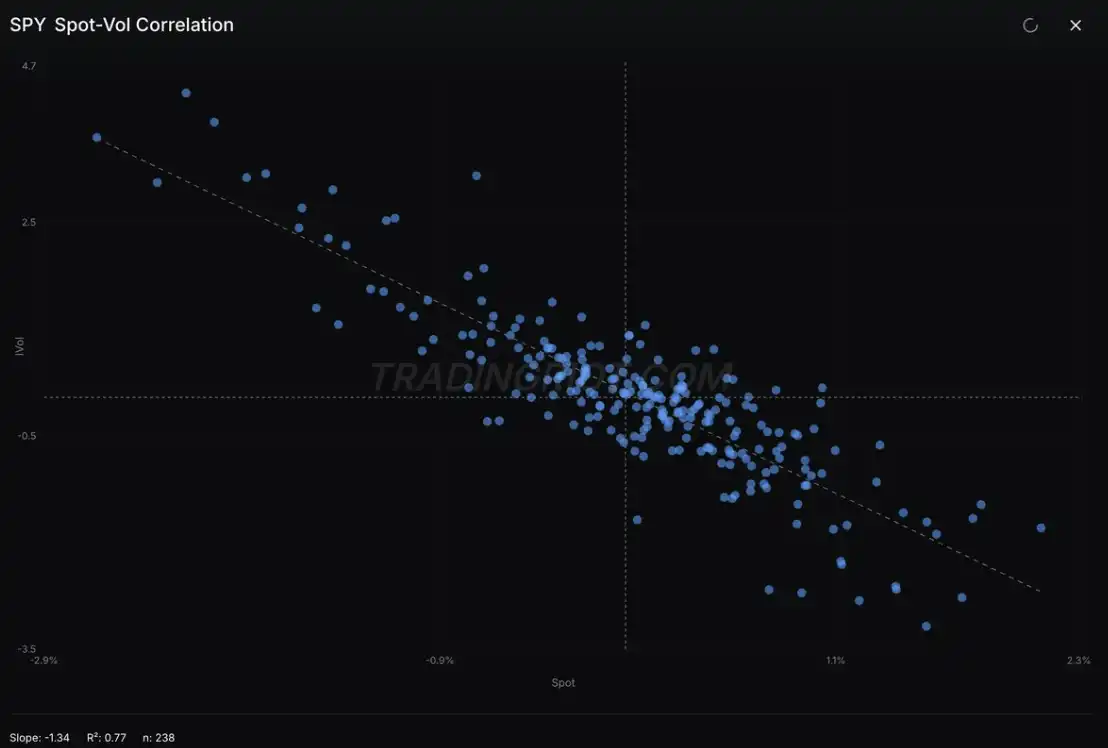
Simultaneously, the Bitcoin spot-volatility correlation, while still somewhat messy overall, is increasingly exhibiting characteristics similar to stock indices.
Summary
If you came here for "Entry / SL / TP" points, then I can only say sorry for disappointing you (not really sorry, though).
The purpose of this analysis is more to clarify a seemingly obvious but often overlooked fact: Bitcoin is a standalone market. At certain stages, it may resemble gold, while at other times, it may behave more like stocks. However, fundamentally, there is no inherent reason for them to exhibit long-term synchronous volatility.
If you are currently fixated on the continuously dropping price, trying to determine when the bottom will appear, instead of applying analogies from other assets, focus on data that is truly important to this market. Look at the position structure—it often tells the most real and brutal story.
Also, don't forget: Most true bottoms are formed when almost everyone has already given up.
You may also like

56% Spike in Memecoin Trading Volume, Yet Shiba Inu (SHIB) Remains Static With 0 Netflow
Key Takeaways: Recent memecoin market saw a volume increase of 56%, highlighting a shift in investor interest towards…

American Airlines Praises Ripple, Surprising XRP Community
Key Takeaways: American Airlines reports exceptional results from Ripple Treasury usage. Ripple Treasury aids treasury efficiency without needing…

USDT Supply Surges to $188B as Tether Solidifies Stablecoin Dominance
Key Takeaways: Tether’s USDT supply reaches an all-time high of $188 billion, maintaining its dominance in the stablecoin…

North Korea’s $500M DeFi Heist Unveils New Cyber Warfare Tactics
Key Takeaways: North Korean operatives have obtained over $500 million from DeFi platforms in under three weeks. The…

How Crypto Futures Markets Are Fueling ‘Scam Coin’ Insider Schemes
Key Takeaways: RAVE’s market cap skyrocketed to $6.7 billion before plummeting by 95% due to insider control and…

XRP Price Prediction: Wall Street Giants Eye Ripple – Should You?
Key Takeaways: Wall Street players like Mastercard and BlackRock are adopting bullish XRP positions. XRP Ledger sees a…
WOJAK Crypto Meme Coin Pumps 87% as MAXI Targets $5M: Unveiling the Trading Insights of 2026
Key Takeaways: WOJAK crypto surged 87% in 24 hours, driven by aggressive accumulation, signaling renewed interest in meme…

XRP Price Prediction: Wall Street Giants Back Ripple’s Future – Should You?
Key Takeaways: Leading Wall Street firms are showing bullish interest in XRP’s price potential. At the Digital Assets…

XRP Price Prediction: Wall Street Giants Shift Focus to Ripple
Key Takeaways: XRP Ledger is seeing massive institutional interest from giants like Mastercard and BlackRock, aligning with overall…

Protect Your Crypto: Practical Steps to Avoid Scams
Key Takeaways: Recognize red flags early by knowing scams like phishing and rug pulls. Secure your assets with…

How Much Is Blueface Worth? Latest Net Worth Revealed (2026)
Key Takeaways: Blueface’s net worth in 2026 ranges from $4 million to $7 million, reflecting both his musical…

Google’s Quantum AI Sparks Ripple’s 2-Year Plan for XRP: What’s the Impact on Holders?
Key Takeaways: Ripple’s multi-phase plan targets quantum cryptography readiness for XRP Ledger by 2028 due to Google Quantum…
Eightco Holdings (NASDAQ: ORBS) Reveals $336M in Digital Assets and Equity Investments
Key Takeaways: Eightco’s treasury includes $90M in OpenAI, $25M in Beast Industries, 11,068 ETH, and $283 million WLD…

DeFi Losses Top $600 Million Amid Kelp DAO Exploit and TVL Decline
Key Takeaways: Total DeFi losses have skyrocketed to approximately $1 billion recently, with $600M+ linked directly to the…

SEC’s “Innovation Exemption” Sets New Rails for Tokenized Securities
Key Takeaways: SEC Chair Paul Atkins introduces an “innovation exemption” to regulate tokenized securities. A five-category token framework…

Ripple Sets 2028 Deadline for Quantum-Ready XRPL
Key Takeaways: Ripple commits to a 2028 deadline for XRPL’s quantum-readiness, focusing on quantum-resistant cryptographic systems. Google’s research…

Key NFT Projects to Watch in 2026
Key Takeaways: Successful NFT investing in 2026 revolves around real-world utility, team credibility, and regulatory compliance. Top picks…
How Syncro Sender Optimizes Solana Transactions for High-Stakes Teams
Key Takeaways: Syncro Sender uses multi-path delivery and staked validator connections to enhance Solana transaction efficiency. It significantly…
56% Spike in Memecoin Trading Volume, Yet Shiba Inu (SHIB) Remains Static With 0 Netflow
Key Takeaways: Recent memecoin market saw a volume increase of 56%, highlighting a shift in investor interest towards…
American Airlines Praises Ripple, Surprising XRP Community
Key Takeaways: American Airlines reports exceptional results from Ripple Treasury usage. Ripple Treasury aids treasury efficiency without needing…
USDT Supply Surges to $188B as Tether Solidifies Stablecoin Dominance
Key Takeaways: Tether’s USDT supply reaches an all-time high of $188 billion, maintaining its dominance in the stablecoin…
North Korea’s $500M DeFi Heist Unveils New Cyber Warfare Tactics
Key Takeaways: North Korean operatives have obtained over $500 million from DeFi platforms in under three weeks. The…
How Crypto Futures Markets Are Fueling ‘Scam Coin’ Insider Schemes
Key Takeaways: RAVE’s market cap skyrocketed to $6.7 billion before plummeting by 95% due to insider control and…
XRP Price Prediction: Wall Street Giants Eye Ripple – Should You?
Key Takeaways: Wall Street players like Mastercard and BlackRock are adopting bullish XRP positions. XRP Ledger sees a…
